How are report definitions structured?
Using report definitions, you specify contents and layout of a report. A report definition is divided into sections and sub-sections , headers and footers and a cover page . In these structural elements, you can insert various elements, such as analysis components , images , function and data fields , texts , or hyperlinks . Using formatting tables , you can place and arrange the various elements in the different sections and rows.
Contents and layout are displayed schematically with individual placeholders inserted for analysis components, such as data fields, tables or charts. The associated data of the linked queries and fields are added when running the report definition and displayed in the finished report.
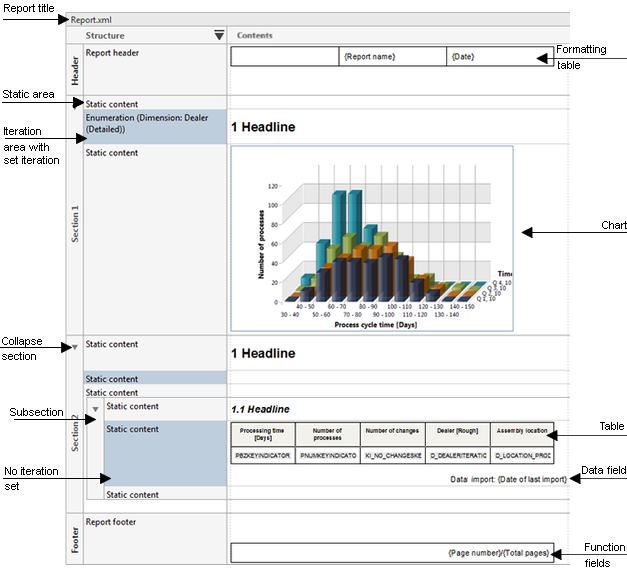
The Structure column illustrates the hierarchical structure and the Contents column displays the inserted analysis and layout components of the report definition.
You can hide the text displayed in the Structure column by clicking the Display menu ( ) button in the header and selecting Structure only.
Structural levels
A report definition can have any number of sections . A section or sub-section can have any number of sub-sections at the same structural level. You can specify up to six structural levels. Sub-sections are displayed with an indent in a section.
You can reduce the display of a section to one line.
Headers and footers
Headers and footers can be displayed on the individual report pages. Sections can have their own headers and footers, which replace the header and footer of the report pages. You cannot insert analysis components in headers and footers. Headers and footers are marked gray in the report definition.
Iteration area and static area
A section has one iteration area (blue) and two static areas (grey), with one static area above and one below the iteration area. You can insert any content in the individual areas. The content of the static areas is displayed only once during the execution of the report definition. The content of the iteration area of a section is displayed as many times as the number of steps of a set iteration.
As long as no iteration is set for a section, all content of the section is displayed as static. A set iteration in the iteration area is displayed in the Structure column.
Moving the mouse pointer over an element in your report definition displays a tooltip containing further information.