How does the outlier analysis work?
With the outlier analysis , you can identify process instances with a certain measure value above or below the average value or a defined limit value.
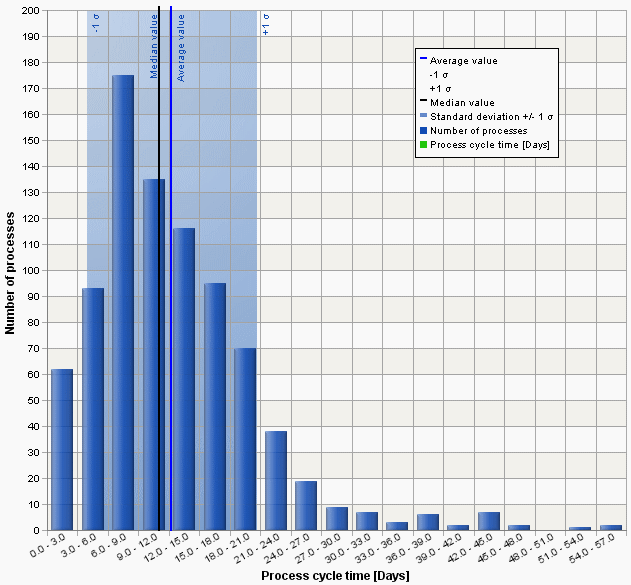
PPM looks for conspicuous process instances in distributable standard measures (process, function and relation measures) based on the standard deviation of the average value of a measure. It automatically calculates a tolerance range as a multiple of the standard deviation, or you define a fixed limit value or specify a favorite that determines the value dynamically at the time of the query. Process instances outside the defined tolerance range are anomalous. The result is displayed as a process instance list.
The following figure illustrates the outlier analysis principle. Outliers are the process instances right of the blue area. The tolerance range comprises six times (-/+) the standard deviation of the average value.