Statistically evaluate analysis
Use a to evaluate your analysis statistically. For a number of selected process instances, you can display the average value of their distribution via a measure with the corresponding standard deviation, the median and percentiles.
In a distribution chart, you can display the frequency distribution of a distributable measure's values for a number of process or function instances.
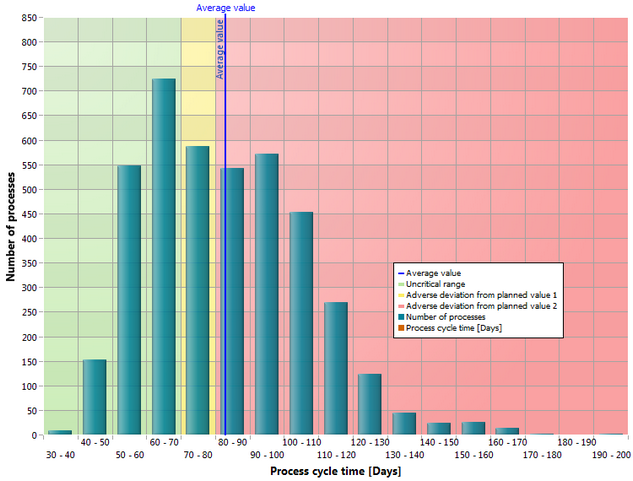
On the y-axis, the number of processes or functions run for the values of a distributable measure (x-axis) is displayed.
If you want to display planned values, the chart is divided into the colors green, yellow and red. Additionally, you can use statistical analysis options for this chart type, such as average value of distribution with the corresponding standard deviation, median, and percentile.
The calculation of median and percentiles is available for process, function, relation, average, and sum measures. This function is not available for cardinality, shared function, function span, and process instance-independent measures. All allowed measure data types are supported. Aggregated process instances and process instance lists are not supported.
Statistics information cannot be displayed in a distribution chart if you configured user-defined steps for the distributed measure.
Prerequisite
Your analysis is displayed as a distribution chart.
Display the Base tab bar.
Click
 Display options.
Enable the Statistics page for the set dimension axis.
Specify your settings.
The selected statistical values are displayed in your chart.
You can also display statistical values as more dimension steps and comparison values in your analysis.