Use case - How to analyze your organization's performance
This use case shows you step by step how to create a communication analysis and a Relation Explorer.
We recommend that you use the PPM demo database to work with the use case. Depending on the data basis used in PPM, the calculation results described in the use case may deviate from the actual results.
You want to analyze the communication structure of order processing in your company in more detail, as some customers have complained of long response times for their inquiries. In order to identify possible weak spots, you want to know who cooperates with whom and how long they communicate. You are mainly interested in sales support and dealer sales as both occupy a key position in your order processing You also want to find out which activities the involved organizational units perform and how often.
Your procedure consists of the following steps:
Create a communication network including an analysis of process cycle time. Customer satisfaction could be increased by optimizing this measure.
Create Relation Explorer including an analysis of individual dealer sales activities and processing time of customer orders.
Use the Communication Analysis Wizard to select the relevant view and configure all settings required.
Display the PPM start page.
Under Analysis realms, double-click Interaction analysis.
Interaction analysis opens on a separate tab.
Display the Base tab bar.
Click
 New.
New.Double-click Communication analysis.
The Communication Analysis Wizard is launched.
Select the cooperates with relation and select the Order processing process group in the process tree.
Only process instances of the Order processing process type containing the cooperates with relation are evaluated.
Click Next.
Select Communication network as the view type.
Click Next.
Set the step width.
Click Change.
Select a rough step width for the source and target dimension.
Click OK.
Click Next.
Select Process cycle time as the measure.
Click Next.
Set the filter.
Double-click the Time dimension.
On the Absolute tab, click
 Set period of time.
Enter 2010 for the year and 3rd quarter for the quarter.
Click OK.
Click Finish.
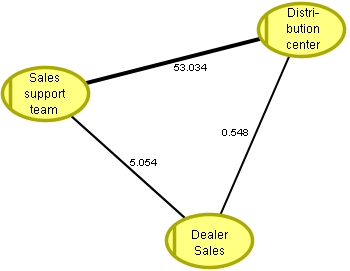
The result of your analysis is displayed as a communication network in the analysis area.
The individual organizational units are linked to each other by the cooperates with connection, at which process cycle times are shown as values. Since this measure is a process measure the measure value describes the performance of all processes containing the relevant connection. Therefore, all measure values are identical at this rough level.
Display the Query tab bar.
Click
 Planned values.
Planned values are included in the communication network. Critical elements are highlighted in color.
Overall, the performance is in an acceptable range (yellow connections and nodes). Only the organizational unit Sales support team is highlighted in red. This means that the average overall process performance is poor within the sales support team.
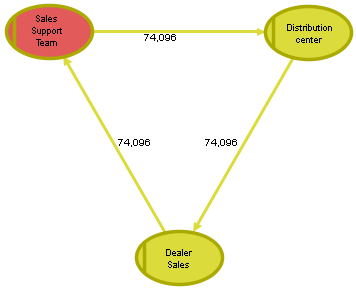
To analyze performance differences within the team, you can refine the organizational unit Sales support team.
Right-click the organizational unit Sales support team.
Select the option Refine nodes from the pop-up menu.
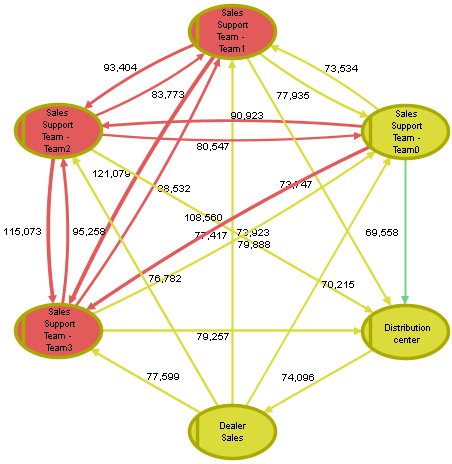
The communication network displays the individual sales support teams and their communication as well as the communication with the dealers and the distribution center.
The color of the connections and nodes shows you at a glance where the major performance bottlenecks occur (red connections and nodes). For example, TEAM 0 of sales support shows the best performance (yellow node), with their communication with the distribution center even showing a green connection, which means excellent.
Relation Explorer is to show which activities dealer sales has performed and how long these activites took.
Launch the Relation Explorer Wizard.
Display the Base tab bar.
In the toolbar, click
 Back to display the previous communication network.
Right-click the organizational unit Dealer Sales.
Select the option Display in Relation Explorer from the pop-up menu.
The Relation Explorer Wizard is started. The settings for the organizational unit you selected are applied in the wizard.
Apply the settings on the page Select organizational unit.
The organizational unit Dealer Sales is already selected. This means that the organizational unit Dealer Sales is analyzed and displayed as the central dimension.
Click Next.
Apply the settings on the page Select process instances.
Only process instances of the Order processing process type are evaluated.
Click Next.
Select the Executes relation and click
 Set filter.
Select the Processing time measure.
Activate the Step width tab and select the With process relation option.
The Executes relation is evaluated with the corresponding activities. The average processing time of the process in which the relation occurs is output.
Click OK.
Click Next.
Click Finish.
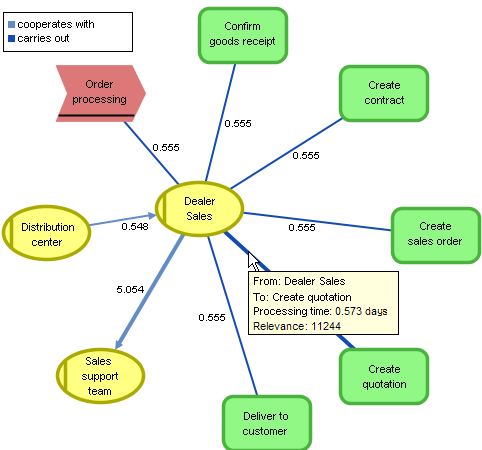
The result of your analysis is displayed as a Relation Explorer in the results window.
The Relation Explorer indicates who the organizational unit Dealer Sales communicates with and how frequently, and it represents the activities that the organizational unit Dealer Sales performs as well as the process with which the organizational unit has a relation. The figures at the connections indicate the measure values for the relation, the communication frequency, or the average processing time for performing an activity and the process. Moving the mouse over a connection displays a tooltip showing the source and target object, the measure value and the relevance. The relevance specifies how frequently the central organizational unit executes an activity.
For the activity Create quotation Dealer Sales requires an average processing time of 5.73 days, which may be a cause for the long response times for customer inquiries.
Tip
If you want to see who the Dealer Sales team communicates with within a different team, right-click a team and select Refine nodes. A detailed communication structure between the corresponding organizational units is displayed.
Use an outlier analysis to identify the involved process instances and executing organizational units.