How does PPM calculate a suspected deviation analysis for Process mining?
You can use Process Mining to identify suspected deviations and weak spots in your processes. Process Mining automatically identifies conspicuous fluctuations in measure values for particular dimensions.
In the suspected deviation analysis, PPM calculates for each dimension the deviation of dimension values and the standard deviation within a dimension value. The calculation formula is the same for both values and corresponds to the general formula for the standard deviation. The calculation differs only in terms of the reference values.
PPM uses the following calculation formula for the standard deviation:
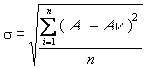
n = Number of dimension values
The following applies to the standard deviation:
A = measure average of a dimension value
Av = relevant measure value of a process instance
The following applies to the deviation:
A = measure average of all dimension values

Av = relevant measure average of a dimension value
To compare the absolute spread values in a ranking, PPM calculates the deviation in percent:
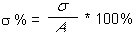
PPM enters the deviation in percent calculated in a ranking list and displays them sorted in descending order in the analysis area.
Each ranking list contains the following columns:
Measure
Indicates the measures with deviations.
Function
Indicates the functions with deviations. If you did not select a function measure, this column is not displayed.
Dimension
Indicates the dimensions with deviations.
Variation range
Indicates the deviation in the dimension in percent.
Max. variation coefficient [%]
Indicates the maximum standard deviation within the dimension values. If no standard deviation is calculated, 0.0 is displayed.