Use case - How to work with interactive analyses
The use case explains step by step how to perform interactive analyses with the help of multi-panel analyses, interactive filters, and ad hoc filters.
You can use multi-panel analyses to display your analysis in various views at the same time and thus compare them easily. Interactive and ad hoc filters enable you to visualize dependencies between individual measures and dimensions in your analyses.
We recommend that you use the PPM demo database to work with the use case. Depending on the data basis used in PPM, the calculation results described in the use case may deviate from the actual results.
You want to view the current performance of the processes in the SUV series business area and, if required, check for weak points.
When running the predefined query of the process cycle time, you see that the current process cycle time is in the critical range. You then extend your performance analysis to include additional analysis views in order to find the weak points in the processes.
Perform the following steps to work with the use case.
Display your predefined performance analysis
Create a multi-panel analysis
Display a distribution chart
Display EPC
Use interactive filter
Use ad hoc filter
This step-by-step multi-panel analysis is available in the favorite 05 Interactive process structure analysis. The favorite is extended by several settings.
Use a predefined favorite to view your performance analysis.
Display the PPM start page.
Under Analysis realms, double-click Process analysis.
Click the Private favorites folder in the Favorites bar.
Double-click the 01 Process cycle time favorite.
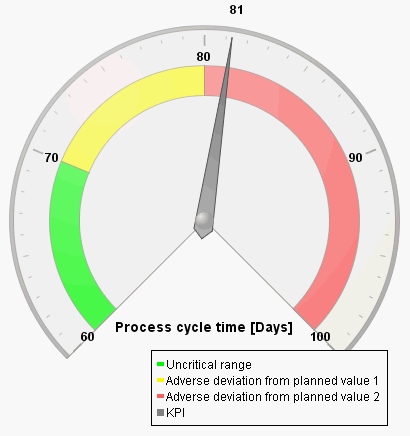
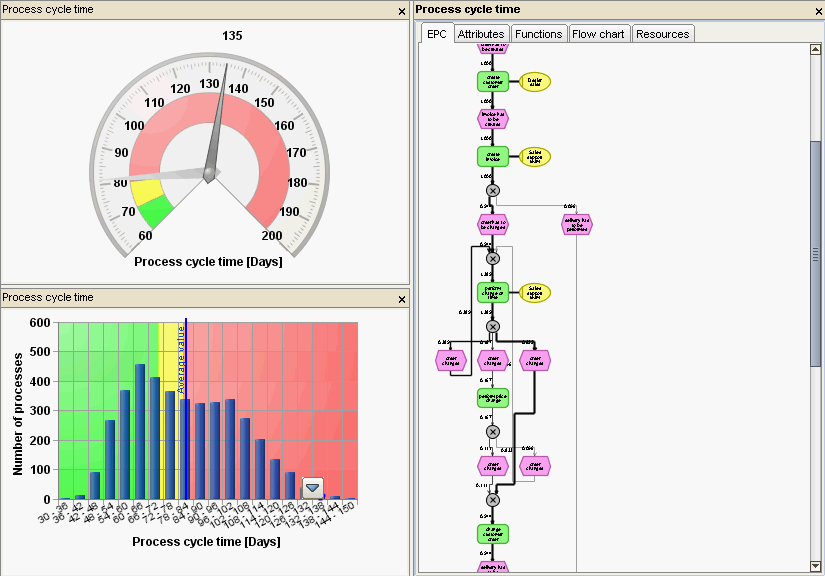
A speedometer chart for the process cycle time is displayed. The speedometer chart shows that the currently measured process cycle time is in the critical (red) range above planned value 2.
Use multi-panel analyses to display your analyses in multiple, different views.
Display a distribution chart of the performance analysis in a second panel.
Display the Base tab bar.
Click
 Additional view.
A second, identical panel is displayed below the first panel.
Move the mouse pointer over the title bar of the new panel to display its toolbar.
Click
 Show distribution in the toolbar of the panel.
A distribution chart is displayed in the second panel.
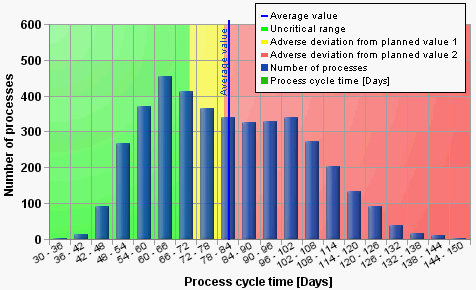
The distribution chart shows how the number of process instances is distributed in terms of process cycle time. The largest part of process instances and the average value are in the critical (red) range.
Display an EPC of the performance analysis in a third panel.
Click the title bar of the second panel to activate the panel.
Click
Additional view in the Basis tab bar.A third, identical panel is displayed to the right of the first two panels.
Click
 Select view >
  Display EPC in the toolbar of the panel.
Right-click in the chart background and
 Fit to window in the pop-up menu to display the EPC in its entirety in the window.
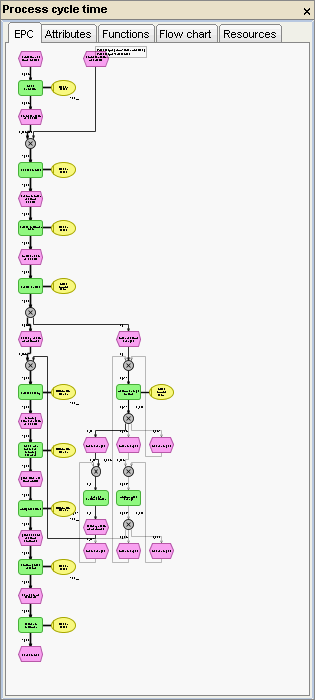
In the third panel, the process is displayed in the form of an EPC.
The EPC shows the aggregated process performance of all process instances with the weight of the connections indicating the relative execution probability of the path.
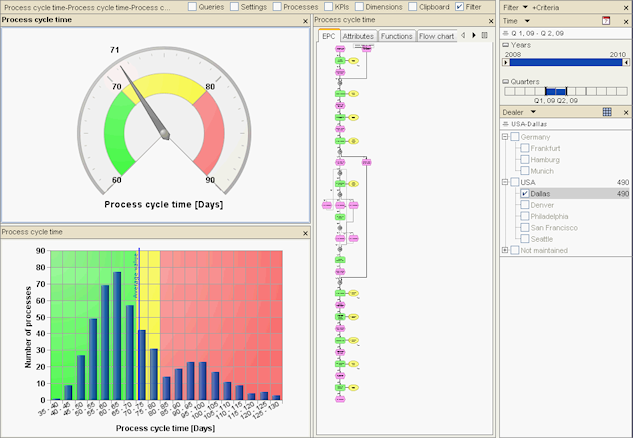
The multi-panel analysis now displays three different views of the process cycle time analysis: One speedometer chart, one distribution chart, and the process flow in the form of an EPC.
When you filter interactively in multi-panel analyses, you can select a criterion in one panel, which will then be applied as a filter for the other panels.
Enable the interactive filter function.
By default, the EPC view function is not enabled for performance reasons.
Click
 Display options in the toolbar of the EPC panel.
On the page EPC view settings page, enable the option Include EPC view in interactive filtering.
Click OK.
Display the Visualization tab bar.
Click
 Interactive filtering.
Interactive filtering is now enabled and can be used for the EPC view.
Select the filter criteria for short and long process cycle times.
Click the distribution chart to activate it.
Click
 Select data range in the Visualization tab bar.
Draw a selection frame around the area with the short process cycle times, for example, from 27-36 to 36-45 days.
Draw a selection frame around the area with the long process cycle times, for example, from 126-135 to 198-207 days.
The individual areas are highlighted in the distribution chart and the panels with the speedometer chart and the EPC change accordingly.
When comparing the different processes, you see that the main reason for the long process cycle time lies in the frequent changes in billing. Billing changes do not occur in the processes with short process cycle times.
Use ad hoc filters to set filters to be simultaneously applied to all panels in a multi-panel analysis.
Display the Filters bar.
Display the Filters tab bar.
To add another filter criterion, click
Select criteria.In the Available dimensions/measures column, double-click the Dealer dimension to add dealers as another criterion.
Click OK.
The filter criterion Dealer is displayed in the Filters bar.
Select individual filter values, such as Dallas, to display the analyses for the various dealers.
The analyses of the individual panels are displayed in line with the selected filter criterion, that is, the individual dealers.
When comparing the process cycle time for the individual dealers, there are major differences in the processes, especially between the dealer in Dallas with the shortest process cycle time and the dealer in San Francisco with the longest process cycle time.