Use case - How to work with time range dimensions
This use case illustrates step by step how you can use time range dimensions to identify bottlenecks in your processes.
We recommend that you use the PPM demo database to work with the use case. Depending on the data basis used in PPM, the calculation results described in the use case may deviate from the actual results.
For next year's capacity planning you want to gain an overview of production delays that occurred in the past year. You are particularly interested in the number of processes having been simultaneously in production and how many of those remained in production too long, that is, exceeded the planned goods issue date.
For this analysis, you can apply the time range dimension Production period. Its start time is based on the start time of the function Create delivery, and its end time is based on the function Post goods issue. If a process does not have the Create delivery function, this process instance will not be included in the analysis of processes in production because there is no criterion for determining that the process is overdue. Such a process instance is always assigned the dimension value Not specified.
With the Timely goods issue dimension, the individual process instances with late or on-time goods issue can be identified. Goods issue is on time (dimension value = On time) if the end time (Post goods issue) is earlier than or equal to the planned goods issue date.
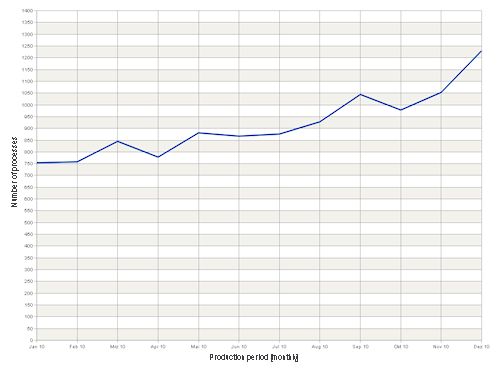
Use a two-dimensional line chart to analyze the development of processes that were in production within the same period.
In order processing, you identify for a certain period the number of processes in production and represent the results in a monthly overview.
To do this, set the following parameters for your analysis.
Process type: Order processing
Measure: Number of processes
Dimension: Production period
Step width (production period): by month
Filter: Production period (absolute): 2010
Display the PPM start page.
Under Analysis realms, double-click Process analysis.
Use the wizard to create a two-dimensional line chart.
Specify the parameters as described above.
The analysis is displayed with the settings you specified. The analysis shows that the number of processes in the In production status increased in the course of the year.
Example: Monthly number of processes in the Production period selected
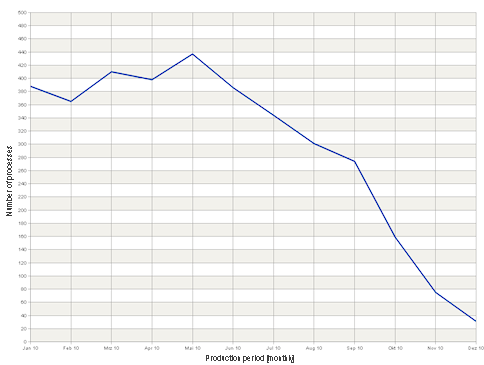
To find out how many processes exceeded the goods issue date you can filter the processes in the selected production period using the dimension Timely goods issue.
To do this, set the following parameter for your analysis.
Filter (Timely goods issue): Late
Display the Query tab bar.
Click
 Set filter.
Select the dimension Timely goods issue as a filter criterion.
Set Late as the filter value.
The analysis is displayed with the settings you specified. The analysis shows that goods issue occurred late very often in the first two quarters of the year 2010 and that punctuality increased significantly towards the end of the year.
Example: Processes with exceeded goods issue date
You want to gain an overview of the development of on-time and late goods issue for the past year.
To do this, set the following parameters for your analysis.
Dimension: Timely goods issue
Step widths (Timely goods issue): On time and Late (default setting)
Remove the filter Timely goods issue.
Add the dimension Timely goods issue to the analysis.
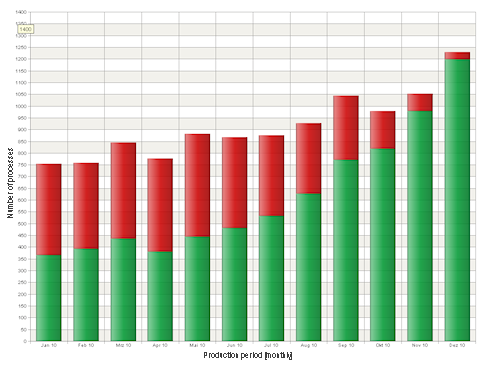
The chart displays a line each for timely and late goods issue.
Select a two-dimensional stacked column chart as the view type.
The analysis is displayed with the settings you specified. The steps On time and Late of the dimension Timely goods issue are displayed as data points of the column chart. The comparison shows that the ratio changed in the course of the year toward on-time goods issue.
Example: Comparison of processes in the production period selected