Use case - How to work with reports
This use case shows you step by step how to create a report definition and display the final report.
We recommend that you use the PPM demo database to work with the use case. Depending on the data basis used in PPM, the calculation results described in the use case may deviate from the actual results.
Prerequisite
For this use case, you need the Report management function privilege.
You want to create a report that you can use to represent the process cycle time of the SUV series division in your order processing for each dealer based on the products. The report is to evaluate a specific period of six months and contain a comparison to the preceding year.
You need a tabular and a graphic representation for your evaluations. You want to display the data individually for each dealer. Tables and charts are to be labeled with unique names. Your report is to contain a cover page and you also want to define a header and footer to appear on each page of your report. Since you want to use the report for presentation purposes, the output form should match your company's corporate identity. You require the current data in the form of an HTML file for your intranet and in the form of a PDF file for printing.
In addition, you want to make the report definition available to other PPM users.
Perform the following steps to work with the use case.
Save analysis as a favorite
Define data of the evaluation
Create report definition and set Dealer dimension as first enumeration
Insert sub-section and set Product dimension as second enumeration
Insert queries
Insert data fields
Save report definition and run report
Make report definitions available to other users and user groups
Save report definition on the server
Register report definition
To be able to use your analysis in a report you need to save the query as a favorite.
Create a measure analysis, for example, in the form of a column chart.
In the process tree, select the cross series process type in the Order processing process type group.
Select the Process cycle time measure and the Time dimension.
Set a filter for the Time dimension covering a specific time period of six months, for example, January to June 2011.
Select the chart type you want to display later in your evaluation.
Specify the appearance of the chart, such as labeling and colors.
Save your settings as a SUV series process cycle time chart favorite in the Reporting folder.
Switch to table view.
Specify the appearance of the table.
Save your settings as a SUV series process cycle time table favorite in the Reporting folder.
Your queries are available as favorites for your report definition in the selected folder.
First, create a new report and then insert the relevant dealers as an enumeration criterion.
Click PPM > Configuration.
Display the Configuration bar.
Click Report definitions in the Configuration bar.
Click
 New to create a new report definition.
An empty report definition is displayed.
In Section 1, click in the enumeration area (blue area in the middle).
Display the Format tab bar.
Click Section properties.
Display the Enumeration page.
Enable the Set enumeration option.
In the process tree, click the cross series process type from the Order processing process type group.
In the Available dimensions/measures list, double-click Dealer.
Click OK.
The Dealer dimension is displayed as an enumeration criterion in section 1.
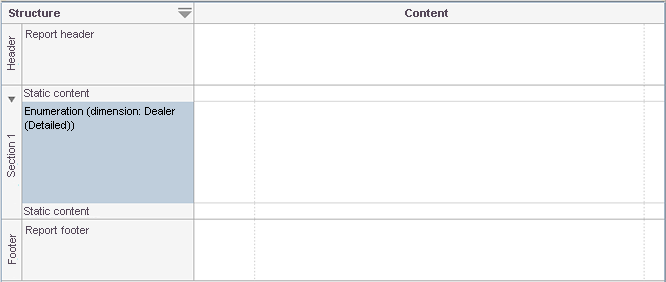
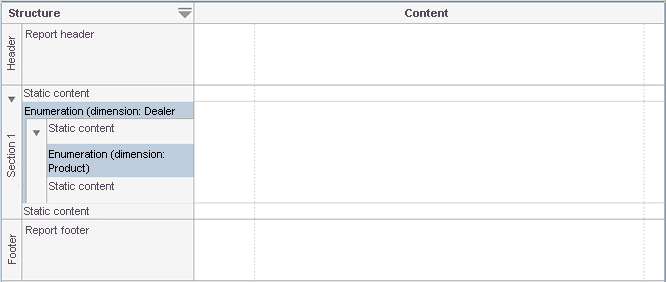
The individual products are to be listed in the report for each dealer. Insert a sub-section with the enumeration criterion Product in the report definition.
In Section 1, click in the enumeration area (blue area in the middle).
Display the Insert tab bar.
Click Sub-section.
Click in the enumeration area of the sub-section inserted.
Display the Format tab bar.
Click Section properties.
Display the Enumeration page.
Enable the Set enumeration option.
In the process tree, click the cross series process type from the Order processing process type group.
In the Available dimensions/measures list, double-click Product.
Enable the Include enumeration of superordinate section option.
Click OK.
Section 1 now includes a sub-section with the criterion Product.
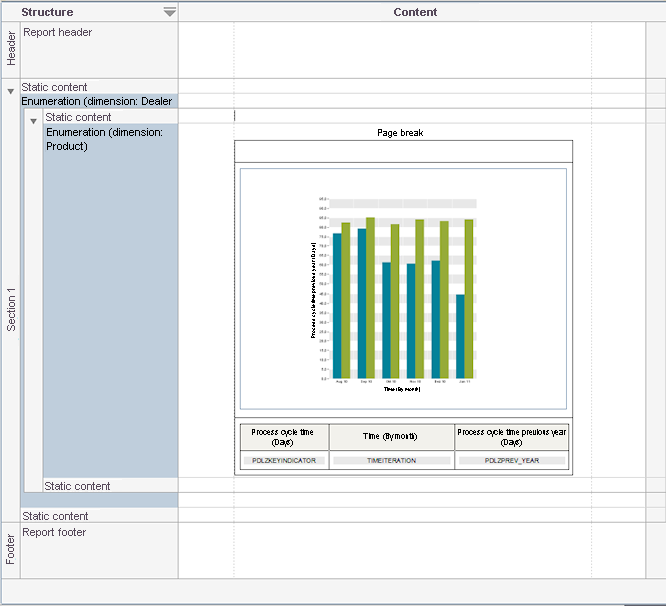
Insert the previously created queries as analysis components in the report definition.
Click in the enumeration area of the sub-section.
Display the Insert tab bar.
Click Page break.
Each sub-section starts on a new page in the report.
Insert a line break in the enumeration area by pressing Enter.
Click Formatting table in the Insert tab bar.
For Number of columns, enter 1 and for Number of rows, enter 3.
Click OK.
Click in the second field of the formatting table.
Click
 Chart in the Insert tab bar.
In the Reporting favorites folder, select the SUV series process cycle time chart favorite and click
 Add.
Add.Click OK.
Click in the third field of the formatting table.
Click
 Table in the Insert tab bar.
In the Reporting favorites folder, select the SUV series process cycle time table favorite and click
Add.Click OK.
The analysis components are inserted in your report definition and are displayed schematically.
Using data fields, you can insert data in your report. The data is queried when the report definition is run and then inserted in the relevant position in the report.
Click in the first field of the formatting table.
Enter the text Dealer: and a space.
Display the Insert tab bar.
Click the Data field button.
Double-click Dealer and select Value.
Click Insert.
Behind the data field, enter /Product: and a space.
Click the Data field button.
Double-click Dealer.
Double-click Product and select Value.
Click Insert.
Click in the header of the page and insert a formatting table with one row and three columns.
Click in the left field of the formatting table and enter a Company name.
In the middle field of the formatting table, insert the Report name data field.
Display the Format tab bar.
Click
 Centered.
In the right field of the formatting table, insert Date: and a space followed by the Date field.
Click
 Align right.
Click in the footer of the page and insert a formatting table with one row and two columns.
In the right field of the formatting table, insert Page: and a space followed by the Page number and Total pages fields.
Separate the two data fields with / and right-align the inserted text.
The data fields are inserted in your report definition and displayed schematically.
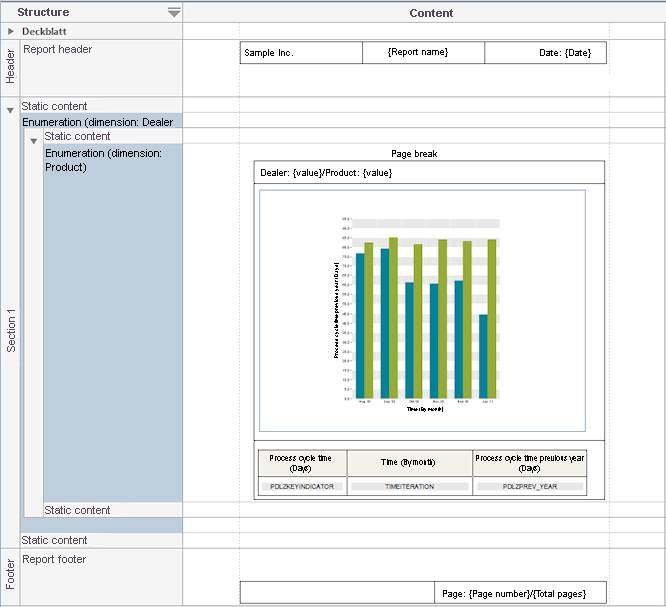
You can add a cover page to your report. The cover page is output when you run the report definition.
Display the Format tab bar.
Click the Report properties button.
Enable the Use cover page option.
Click OK.
The cover page is displayed.
Click in the cover page and enter the text Report.
Insert a line break.
Insert the Report name data field.
Center the text on the cover page.
Select the text and click
Centered to align the text horizontally.To align the text vertically, you can use the Enter key to insert blank rows.
Select the text and in the Format tab bar, set the font size to 20 and select Bold as character format.
The cover page is displayed in your report definition.
If you want to have a better overview of your report definition you can hide the cover page by clicking  Hide in the Structure/Cover page column.
You can run the report definition and output the report in your preferred formats.
Display the Base tab bar.
Click
 Save >
  Save as.
Select a directory and enter Standard order process cycle time as the file name.
Click
 Run under.
Select PDF as file format and English as language.
Click OK.
Select a directory and enter SUV series process cycle time as the file name.
Click Save.
Your report is opened in a PDF document.
Click
Run under again.Select HTML as file format and English as language.
Click OK.
Select a directory and enter SUV series process cycle time as the file name.
Click Save.
Your report opens in your default browser.
Your report is available as PDF and HTML file in the selected directory.
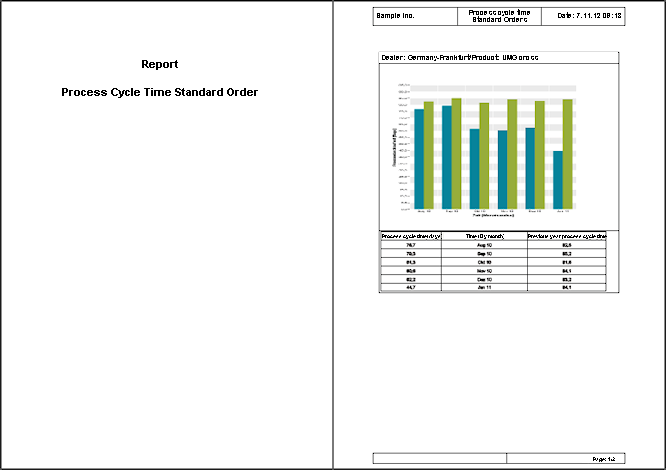
Check if the report meets your requirements and change the report definition, if required.
To provide other users with your report definition you need to save it on the server.
Display the Base tab bar.
Click
Save > Save on server.Enter SUV series process cycle time as name.
Click OK.
The report definition is saved on your server.
To provide other users with your report definition you need to share it with the users first.
Click PPM > Administration.
Administration opens on a separate tab.
Display the Administration bar.
Click Definitions under Reports.
Display the Base tab bar.
Click
 Edit.
Edit.Click
 Register report definitions.
Select the SUV series process cycle time report definition and click Register.
Click OK.
The report definition is displayed in the Registered reports list.
From the list, select the report definition SUV series process cycle time.
On the tabs, enable the Users and User groups that you want to make your report available to.
Click
Save.
Now all users you assigned access privileges for the report definitions to can display the report.
If you no longer wish to make your report available to other users, you can deregister your report.